Analytics
Server statistics, player trends, and performance monitoring
Analytics provides detailed insights into your server’s performance, player behavior, and entity usage over time.
Date Range Selection
Section titled “Date Range Selection”All analytics views support custom date ranges. Click the date picker in the top right to select:
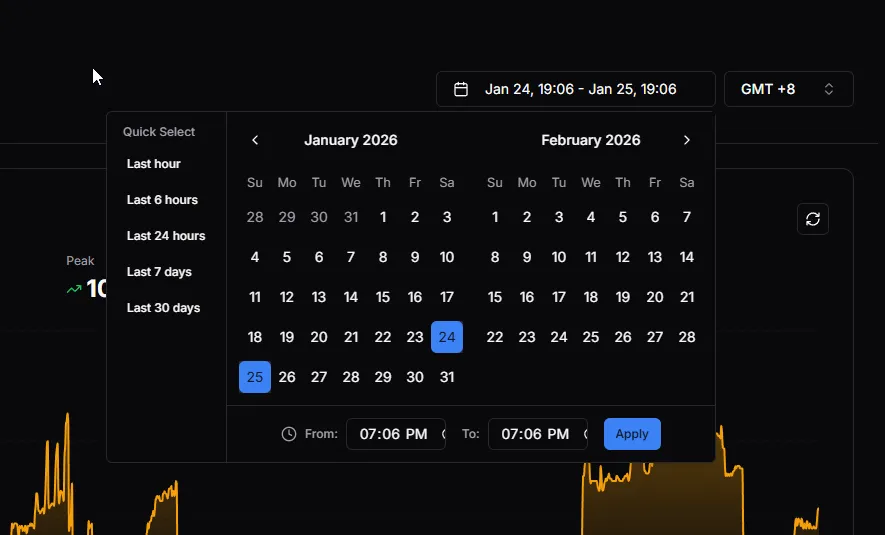
Quick Select Options
Section titled “Quick Select Options”| Option | Description |
|---|---|
| Last hour | Most recent 60 minutes |
| Last 6 hours | Short-term trends |
| Last 24 hours | Daily overview |
| Last 7 days | Weekly patterns |
| Last 30 days | Monthly trends |
Custom Range
Section titled “Custom Range”Select specific dates from the calendar and set exact times with the From and To fields. Click Apply to update the view.
Players
Section titled “Players”Track player count over time to understand your server’s activity patterns.
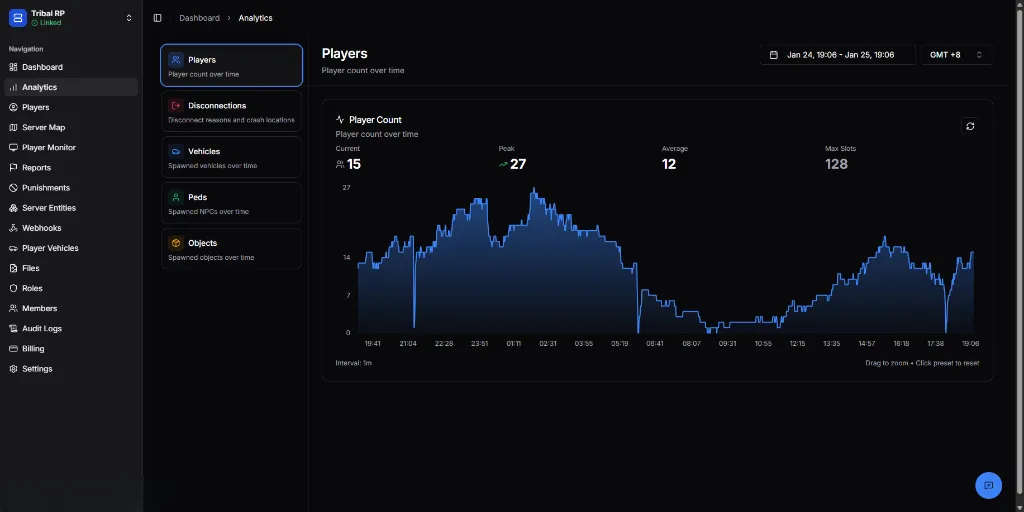
Metrics
Section titled “Metrics”| Metric | Description |
|---|---|
| Current | Live player count |
| Peak | Highest count in selected period |
| Average | Mean player count |
| Max Slots | Your server’s capacity |
Graph Features
Section titled “Graph Features”- Drag to zoom — Select a time range for detailed view
- Click preset to reset — Return to full view
- Interval — Adjust data point frequency (1m shown)
Use Cases
Section titled “Use Cases”- Identify peak hours for events
- Track player retention trends
- Plan server capacity upgrades
- Monitor the impact of updates
Disconnections
Section titled “Disconnections”Analyze why players leave and identify crash hotspots.
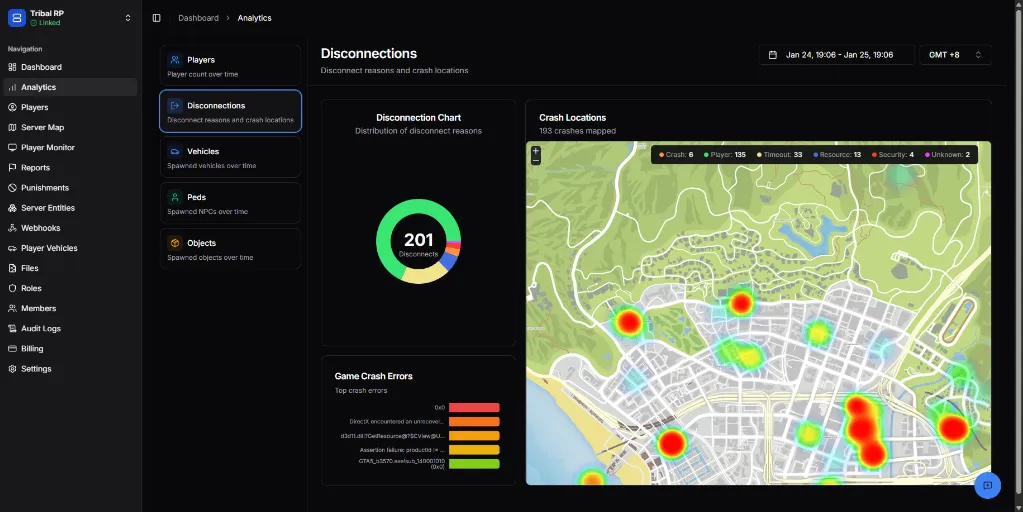
Disconnection Chart
Section titled “Disconnection Chart”The donut chart shows the distribution of disconnect reasons:
- Total disconnects in the selected period
- Color-coded by reason type
Crash Locations
Section titled “Crash Locations”A heat map showing where crashes occur on your server map:
| Color | Meaning |
|---|---|
| 🔴 Red (hot) | High crash frequency |
| 🟡 Yellow | Moderate frequency |
| 🟢 Green (cool) | Low frequency |
Legend categories:
- Crash — Game crashes
- Player — Player-initiated disconnects
- Timeout — Connection timeouts
- Resource — Resource-related issues
- Security — Security kicks
- Unknown — Unidentified reasons
Game Crash Errors
Section titled “Game Crash Errors”Lists the most common crash errors with occurrence counts:
- Direct3D errors
- Resource loading failures
- Assertion failures
Vehicles
Section titled “Vehicles”Monitor vehicle spawning patterns to manage server performance.
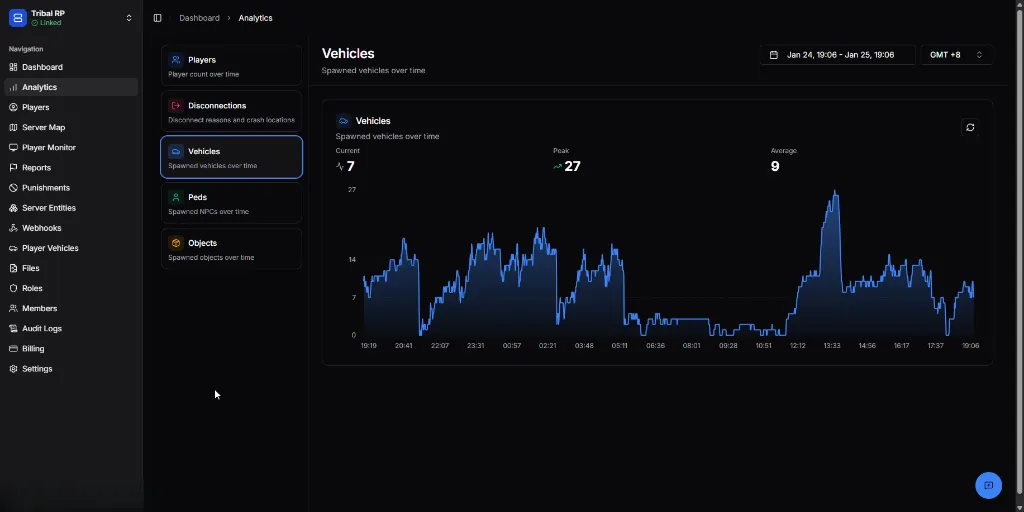
Metrics
Section titled “Metrics”| Metric | Description |
|---|---|
| Current | Vehicles currently spawned |
| Peak | Highest count in selected period |
| Average | Mean vehicle count |
What to Watch For
Section titled “What to Watch For”- Spikes — Events or abuse causing mass vehicle spawns
- Gradual increase — Players accumulating vehicles
- Sudden drops — Vehicle cleanup actions
Track NPC counts (not shown in current screenshots but accessed via the sidebar).
Metrics
Section titled “Metrics”- Current NPC count
- Peak and average values
- Historical trends
Objects
Section titled “Objects”Monitor spawned props and objects that can impact performance.
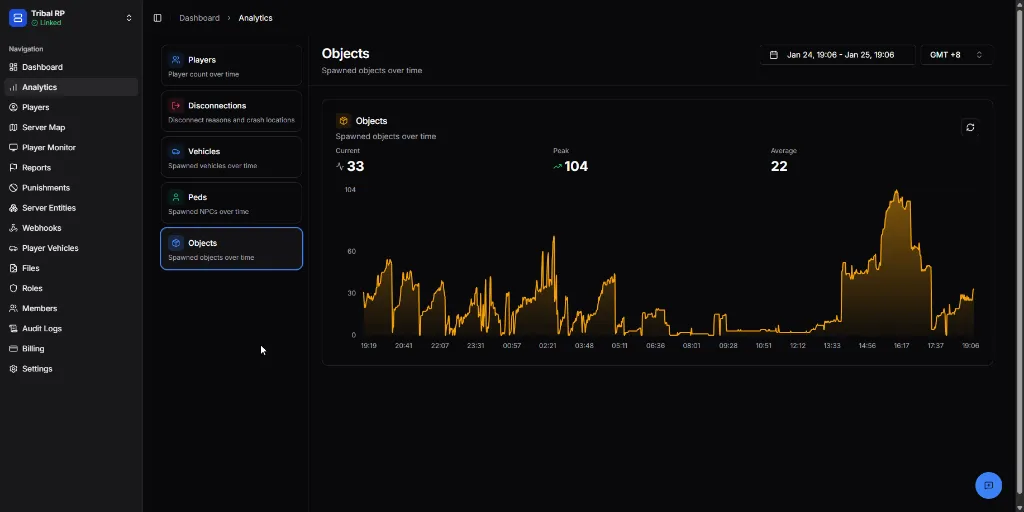
Metrics
Section titled “Metrics”| Metric | Description |
|---|---|
| Current | Objects currently spawned |
| Peak | Highest count in selected period |
| Average | Mean object count |
Performance Considerations
Section titled “Performance Considerations”High object counts can cause:
- Client FPS drops
- Server desync
- Memory issues
Use Quick Actions to clean up when counts get too high.
Best Practices
Section titled “Best Practices”- Check analytics daily — Catch issues early
- Compare time periods — Identify trends
- Investigate crash hotspots — Fix problematic areas
- Schedule cleanups — When vehicle/object counts stay high
- Track peak hours — Plan maintenance windows